Baseball’s appeal is that it is the has changed less than most other team sports, and that perception of constant has been the central source of its appeal.
Pitching is the most recognized, and most critical aspects of baseball yesterday, today, and will be tomorrow.
Through the use of sabermetrics (advanced baseball analytics), teams have changed how their pitchers are deployed, but basic stats like the number of strikeouts are still a good indicator of a pitcher’s dominance.
Intro
There is no doubt that without a good pitcher on the mound, it is very difficult to win a baseball. A team with the most number of high quality pitchers can make or break a team’s season.
At the youth level, more and more teams are using the free app called Game Changer made by Dicks Sporting Goods (Little League World Series used GC in 2022 World Series held in Williamsport, PA) to track game stats.
However, due to inconsistency in how the rules are interpreted (and rules differ among leagues), the records may not be reliable.
Table of Contents
Pitching Records
The official MLB/MiLB scorer records 19 pitching records for each game.
- Innings Pitched
- Batters faced
- At-Bat batters
- Hits made by the batters
- Runs that the pitcher allowed
- Pitches that were hit for a home run
- Sacrifice hits allowe
- Sacrifice flies allowed
- Total walks
- Intentional walks
- Batters hit by a pitch
- Strikeouts
- Wild pitches
- Balks charged to the pitcher
At the conclusion of the game, the names of the pitchers will be assigned for:
- The winning pitcher
- The losing pitcher
- The starting pitcher
- The pitcher credited for the save
Innings Pitched (IP)
IP are counted in one-third fractions only after an out is recorded.
For example, if a starting pitcher (SP) is replaced after putting out the first batter in the fourth inning, SP is credited with pitching three and one-third innings.
However, if an SP is replaced in the fourth inning before making any outs, that SP will be recorded as pitching three innings.
If a relief pitcher (RP #1) completes the fourth inning but another reliever (RP #2) starts the fifth inning, the RP #1 will be credited with two-thirds of an inning.
If the RP #2 completes the nine-inning game, he will be credited with pitching five innings
At-Bat batters (AB)
At-bat for a batter is recorded when a batter reaches a base via any of the following methods:
- Fielder’s choice
- Hit
- Fielding error (excluding catcher’s interference)
At-bat is also charged if a batter is put out on a non-sacrifice hit.
At-bat is NOT CHARGED if:
- Hits a sacrifice fly or on a bunt
- Walked by the pitcher
- Hit by a pitch
- Awarded first base due to interference
| Plate Appearance vs At-Bats |
|---|
| One of the confusing topics is the difference between at-bats vs plate appearance. At-bat record is only created ONLY when one of the previously circumstances are met. Plate appearance record is created when a batter steps into the batters box and a result is between batter and pitcher is concluded (for more info, see MLB Definition – Plate Appearance). Please note that if the batter steps in to the box |
Earned and Un-earned Runs allowed by a pitcher
If the opposing team scores a run, the pitcher will be charged with either an Earned Run (ER) or Unearned Run (UER).
In either situations, it is important to remember that the pitcher ultimately responsible for preventing runs.
Earned Run (ER)
Commonly spoken by TV or radio commenters as “the pitcher allowed X earned runs”, an earned run is charged to a pitcher when he is unable to get the batter out.
Earned runs are charges when no else is at fault, like a defensive mishap committed by an infielder/outfielder or by a catcher (passed balls).
If a pitcher leaves the game with runners on base, and any of those runners score, earned run(s) are charged to that particular pitcher.
Earned run is the primary component of Earned Run Average (ERA) in pitching statistics.
Unearned Run (UER)
In contrast, an unearned run is any run that scores due to an error or passed ball committed by a fielder or catcher.
When playing defense, an error is simply part of a game and sometimes it is really difficult to tell if a fielder should be charged with an error or not.
In addition, a poorly executed defensive play resulting in a hit is not the fault of a pitcher per se, but those hits are charged against the pitcher. Not really fair, huh?
Although UERs don’t count against a pitcher’s ERA, it works against a pitcher because he has to throw additional pitches.
Earned Run Average (ERA)
The second most well-known statistic for pitchers is the Earned Run Average (ERA).
ERA measures the average number of earned runs a pitcher allows per nine innings pitched.
Earned runs are those that result from hits, walks, and hit batters, excluding any runs scored due to errors or passed balls. A lower ERA indicates a more effective pitcher who limits the opposition’s scoring opportunities.
| Best ERA record holder |
|---|
| Bob Gibson had a record of 22-9 with an ERA of 1.12 and 268 strikeouts in 34 appearances in 1968. He won his first Cy Young award, his fourth Gold Glove award and his first MVP award. Bob Gibson’s record still stands today as of 2023! |
To calculate ERA, first divide the number of earned runs allowed by the number of innings pitched. Then multiply the result by nine.
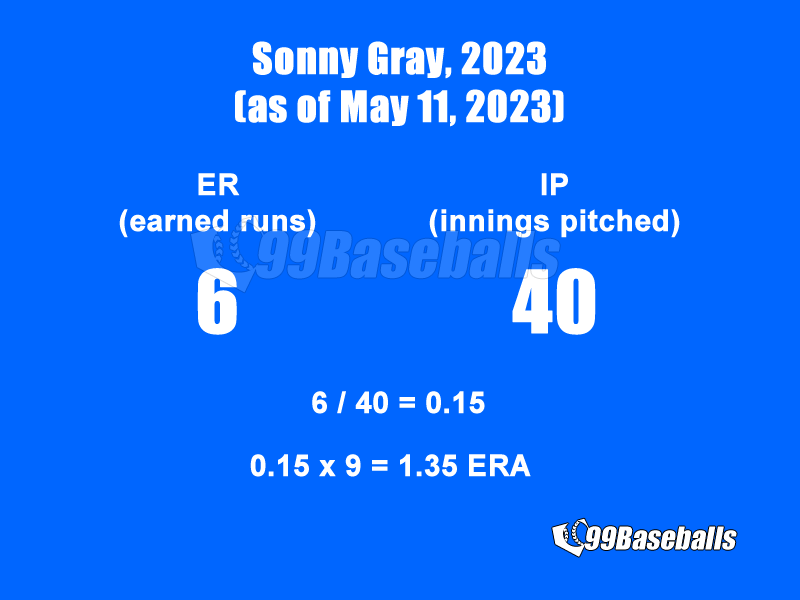
Sonny Gray currently holds 1.35 ERA for the not-yet-completed-2023 season.
While ERA is a useful starting point for evaluating a pitcher’s performance, it is essential to consider other statistics that provide a more comprehensive understanding of a pitcher’s skill set.
Batters Faced (BF)
BF is the total number of plate appearances against a particular pitcher.
| If you are using a Game Changer |
|---|
| it is important to at least input the jersey numbers (names are unimportant if not imprinted on the jerseys). There will be many instances where the play will need to be modified so having a jersey number will allow you to keep accurate track of the scores and games. |
BF can be derived by counting the total number of plate appearances or by adding runs, runners left on base and total outs.
Strikeout (SO, K)
Strikeouts (SO, K) is the most recognized, fundamental statistic for pitchers at all levels of baseball because it showcases a pitcher’s dominance and ability to control the game.
A high strikeout rate signifies a pitcher who can effectively deceive batters, preventing them from making solid contact with the ball.
| Difference between “K” and backwards “K “ |
|---|
| In baseball keeping, the letter K indicates that a batter has struck out while swinging. A backwards or inverted K indicates that a batter has struck out while looking. |
Strikeouts also reduce a pitcher’s reliance on their defense, as fewer balls in play limit the chances for defensive errors.
Saves (S)
The save is given to a relief or closing pitcher who finishes a close win.
A pitcher is awarded a save if he finishes the game but not credited with the win, as long as one of the following three criteria is met:
- Enters the game with a lead of no more than three runs, and pitches for at lease one inning; or
- Enters the game with the potential tying run on base, at bat, or on deck; or
- Pitches for at least three innings
There are few worse things than blowing a game that you were winning until the last inning.
Walks and Hits per Innings Pitched (WHIP)
In contrast to strikeouts, Walks plus Hits per Innings Pitched (WHIP) is a crucial statistic that emphasizes a pitcher’s ability to limit base runners.
WHIP measures the average number of walks and hits allowed per inning pitched. This is because the key to preventing runs is to prevent baserunners in the first place.
A lower WHIP indicates a pitcher who effectively prevents batters from reaching base, which, in turn, reduces the likelihood of runs being scored.
Another words, a pitcher with a low ERA but a high WHIP is an indication that he is allowing a lot of baserunners, and using the law of averages, some of those baserunners are bound to score during the game.
To calculate WHIP, sum up the total number of walks and hits allowed by a pitcher. Then divide the sum by the number of innings.
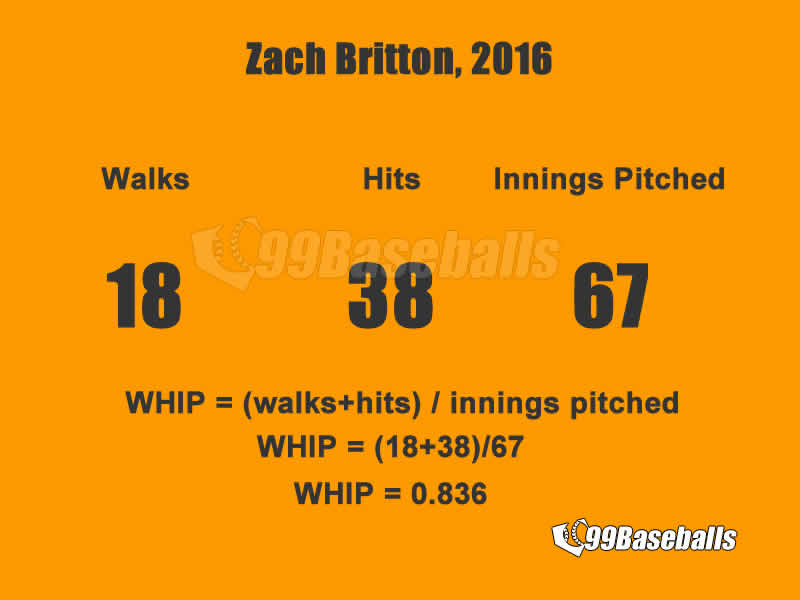
While strikeouts demonstrate a pitcher’s ability to overpower hitters, WHIP showcases their command and control on the mound.
Fielding Independent Pitching (FIP)
Another valuable statistic for evaluating pitchers is Fielding Independent Pitching (FIP).
FIP solely assesses a pitcher’s performance by focusing on the outcomes they have the most control over: strikeouts, walks, hit batters, and home runs.
By isolating these factors, FIP attempts to provide a more accurate representation of a pitcher’s true skill level, independent of the defense behind them.
The formula for calculating FIP is:
FIP = [ (13 x HR) + (3 x BB) – (2 x K) ] / IP + C**
** C stands for a constant; it is simply a number that varies from each year so that the FIP matches the ERA range.
| Who Held the Best FIP in 2022? |
|---|
| Yu Darvish (pitching for Chicago Cubs) had the best FIP (2.07) during the 2020 season. |
Just like the ERA, a lower FIP suggests a more effective pitcher, while a higher FIP may indicate underlying issues not apparent in other statistics such as ERA.
Wins Above Replacement (WAR)
Lastly, Wins Above Replacement (WAR) is an advanced metric that quantifies a player’s overall value to their team.
For pitchers, WAR takes into account various aspects of their performance, including their ability to prevent runs, limit base runners, and maintain a low ERA.
The higher a pitcher’s WAR, the more valuable they are to their team, as they contribute more wins than a replacement-level player would.
Although WAR is not a perfect measure of a pitcher’s worth, it is a valuable tool for comparing pitchers’ overall contributions to their respective teams.
Conclusion
Understanding the key stats that define a pitcher’s performance is crucial for evaluating their effectiveness, skill, and value to their team.
Earned Run Average (ERA), strikeouts (Ks), Walks plus Hits per Innings Pitched (WHIP), Fielding Independent Pitching (FIP), and Wins Above Replacement (WAR) are all vital statistics that provide insight into a pitcher’s abilities on the mound.
As the game of baseball continues to evolve, these metrics remain essential tools for appreciating and analyzing the art of pitching. That is why teams often bring in one, two, or three closers to defeat the batters.